
Feature
Instagram analytics that tell you what to post next

Piyush Sachdeva, Founder, ReelDropPublished
ReelDrop's analytics read your connected Instagram account through the official Graph API and turn the numbers into decisions: which format to make more of, when your posts earn the most engagement, which hashtags pull their weight, and how last week went against your plan. They are on every plan, including the free Starter plan, and they count posts you publish from the Instagram app as well as the ones you schedule here. The one paid part is the media kit, with suggested collab rates and a PDF for brands, on Creator.
On this page
- Where the numbers come from
- Overview: followers, reach, views and engagement
- Top posts and top stories by engagement rate
- Format performance and the content plan verdicts
- Best times to post, from your own posts
- Hashtag performance
- Every post in one table, including ones posted outside ReelDrop
- Story analytics, saved before the story expires
- Trial reel analytics
- Audience: followers, demographics and who engaged
- Weekly recap, posting streak and badges
- Weekly and monthly email digests
- Milestone cards you can share
- Media kit with suggested collab rates, on Creator
- Ask Claude or ChatGPT about your numbers
- Deciding what to make next week
- Answering a brand's email with a price
- Reading a story campaign after it expired
- Analytics by plan
- Read the docs
- FAQ
- Keep exploring
Where the numbers come from
Every metric is Instagram's own, read through the Instagram Graph API for the Business or Creator account you connected, with the permission you gave when you connected it and never with your password. ReelDrop works out the ratios and rankings on top (engagement rate, format verdicts, best windows) and the page says how each one is calculated.
Post and account numbers are fetched when you open Analytics and kept for 15 minutes; an older copy shows while a fresh one loads. Posts you publish outside ReelDrop are picked up about once an hour, and stories are saved every three hours while they are live.
Instagram shares some numbers only past a threshold. Follower demographics, daily follower counts and the online-followers heatmap need at least 100 followers, and the engaged-audience breakdown needs 100 engagements in the period. Account-level insights go back 90 days. The screenshots on this page are the real tabs showing a demo account.
Overview: followers, reach, views and engagement
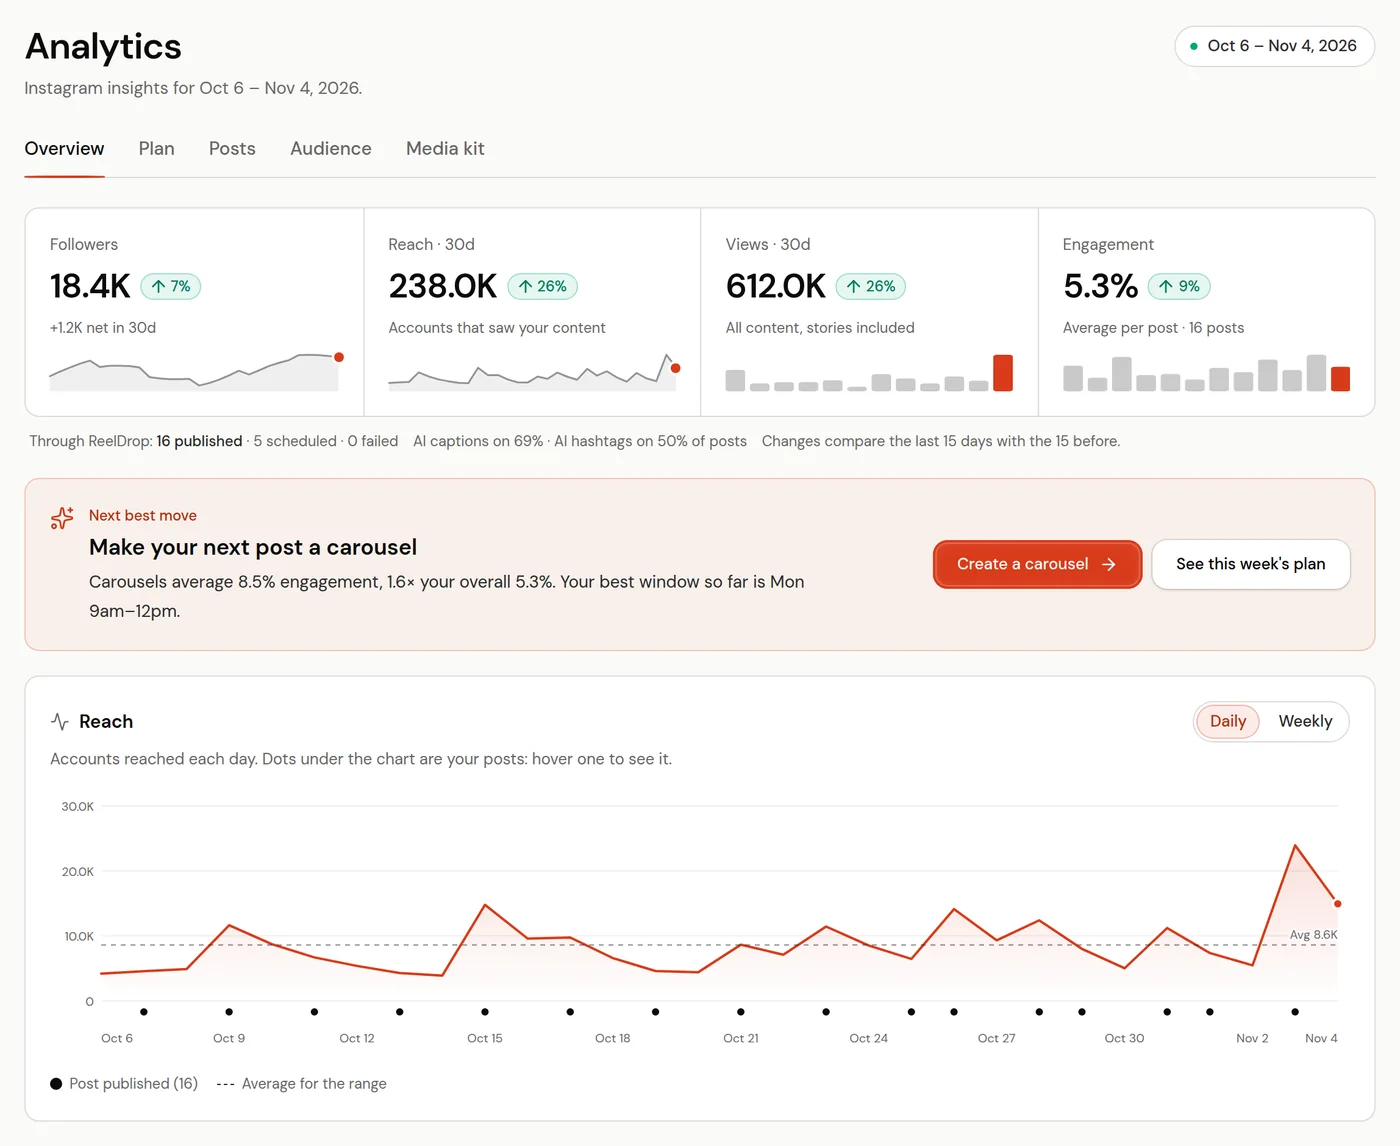
The Overview tab opens on four numbers for the range you pick (the last 7, 14, 30 or 90 days, or any dates): followers, reach, views across all your content including stories, and average engagement per post. Each has a small trend line and a change pill.
The change pills compare the most recent half of the range with the half before it, in whole days: on the default 30 days that is the last 15 days against the 15 before them, and on 7 days the last 3 against the 3 before. Followers are the exception: that pill is the net change over the whole range.
Below them, Next best move names one thing to do, such as "Make your next post a carousel", with a button that opens the composer in that format, and the Reach chart marks each day you posted with a dot you can hover to see the post.
Top posts and top stories by engagement rate
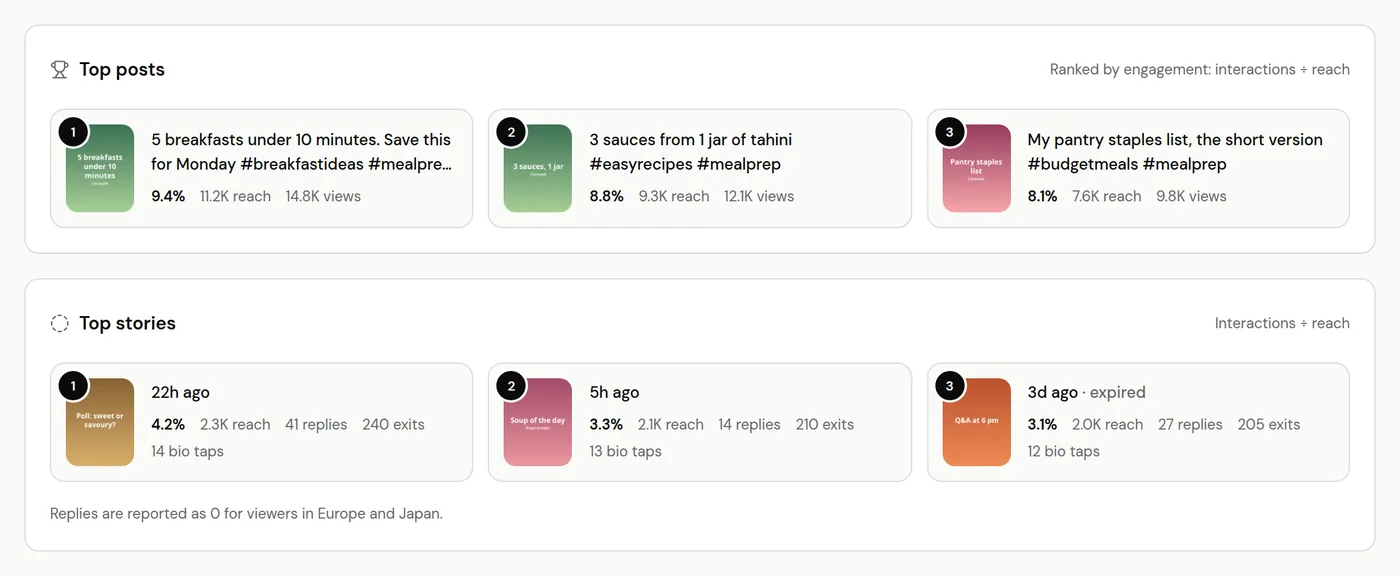
Top posts ranks the three posts in the range with the highest engagement rate: likes, comments, saves and shares divided by reach, with views standing in when Instagram reports no reach. Top stories does the same for stories using Instagram's total interactions divided by reach, because a story has no likes or saves to count.
A third list, Top posts by bio link taps, ranks the feed posts and stories that sent the most people from your profile to the link in your bio. Instagram does not report that for reels.
Format performance and the content plan verdicts
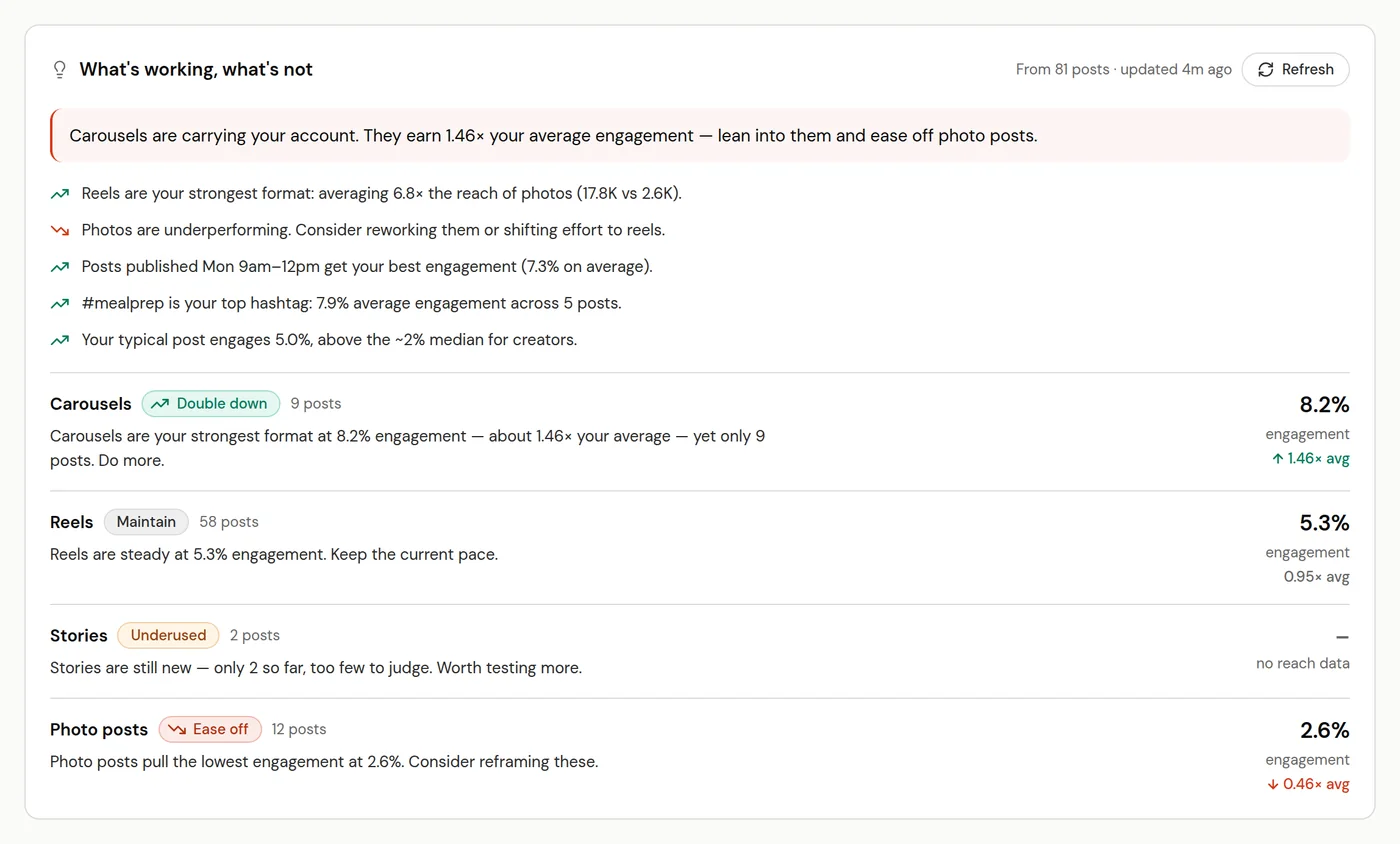
The Plan tab looks at every post you have published and gives each format a verdict: Double down, Maintain, Underused or Ease off, with the reason in one sentence and its engagement against your account average.
The rule: a format earning at least 1.25× your average engagement is strong, and one at 0.75× or less is weak. Strong and under 15% of your posts is Double down, weak is Ease off, and fewer than 3 posts is Underused because that is too few to judge. Everything else is Maintain, or Underused if you rarely post it.
Above the verdicts, This week's game plan sets a post count from your recent pace and names the format to lead with, the time window to post in and the hashtags to reuse. Refresh rebuilds the verdicts from your latest numbers.
Best times to post, from your own posts
When to post is your week in three-hour blocks, in your timezone, shaded by the average engagement your posts earned in each block, with a dot wherever you actually posted. Your best windows lists the top three, trusting windows with two or more posts first, so one lucky post does not top the list.
The Audience tab adds When your followers are online: the hours your followers are on Instagram, averaged over the last 30 days. The two answer different questions. The grid says when your posts have done well; the heatmap says when people are around to see them. Until you save your own posting slots, ReelDrop suggests slots from the online hours.
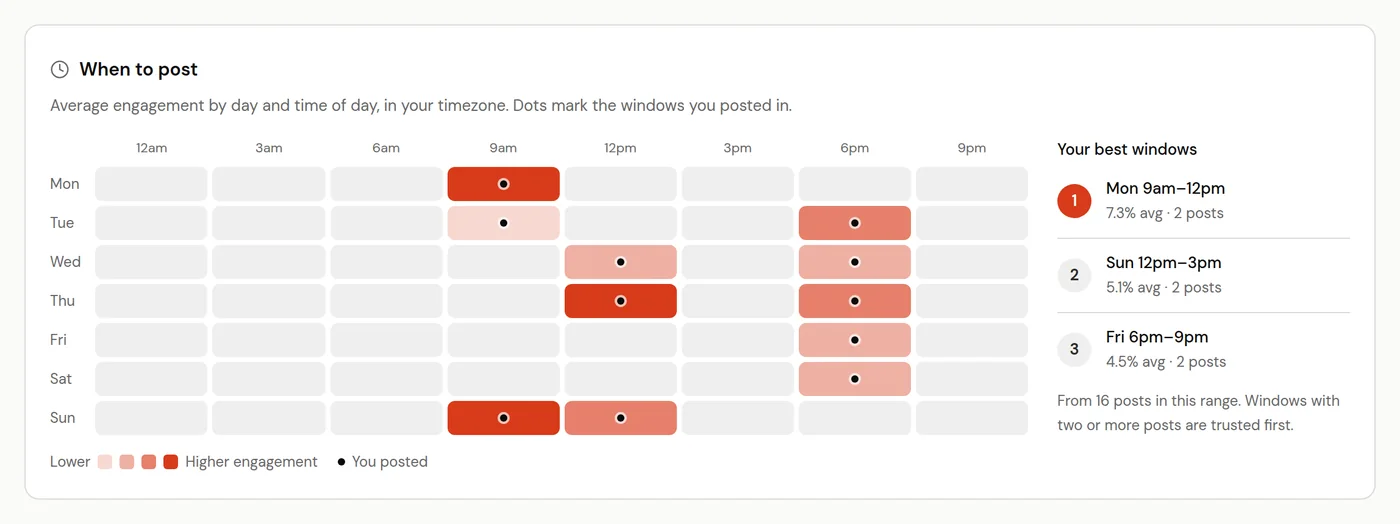
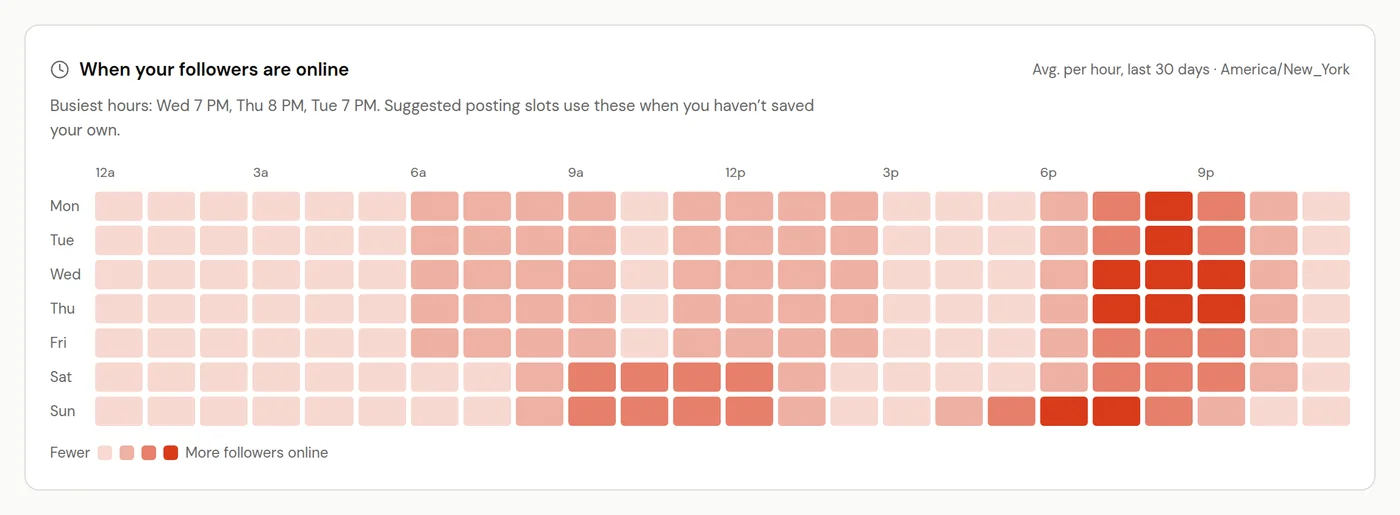
No posting history yet? The free best time to post tool starts from published studies and your audience's region instead. Once you have a few weeks of posts, your own grid is the better guide.
Hashtag performance
Hashtags ranks the tags in your captions by the average engagement of the posts that used them, with average reach beside each one. A tag has to appear on at least two posts in the range to be listed, so the ranking is about tags you actually reuse. Formats sits next to it with average reach and engagement for reels, carousels and photos.
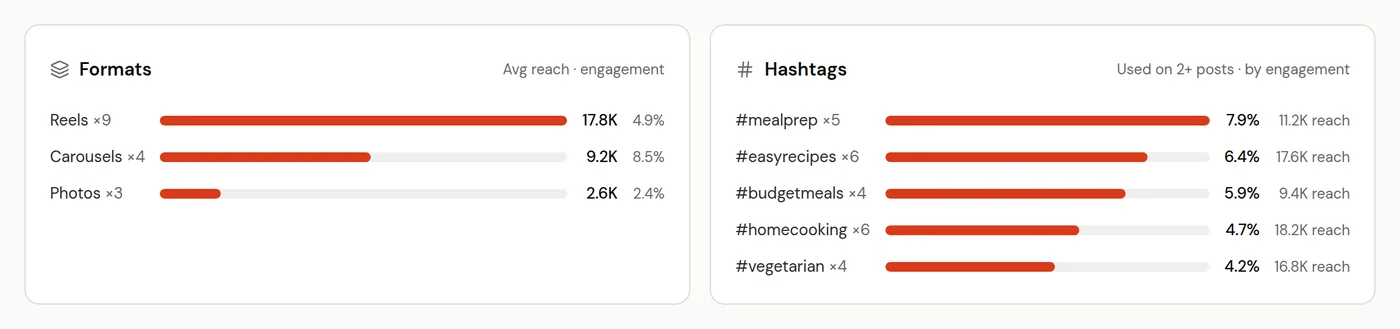
Every post in one table, including ones posted outside ReelDrop
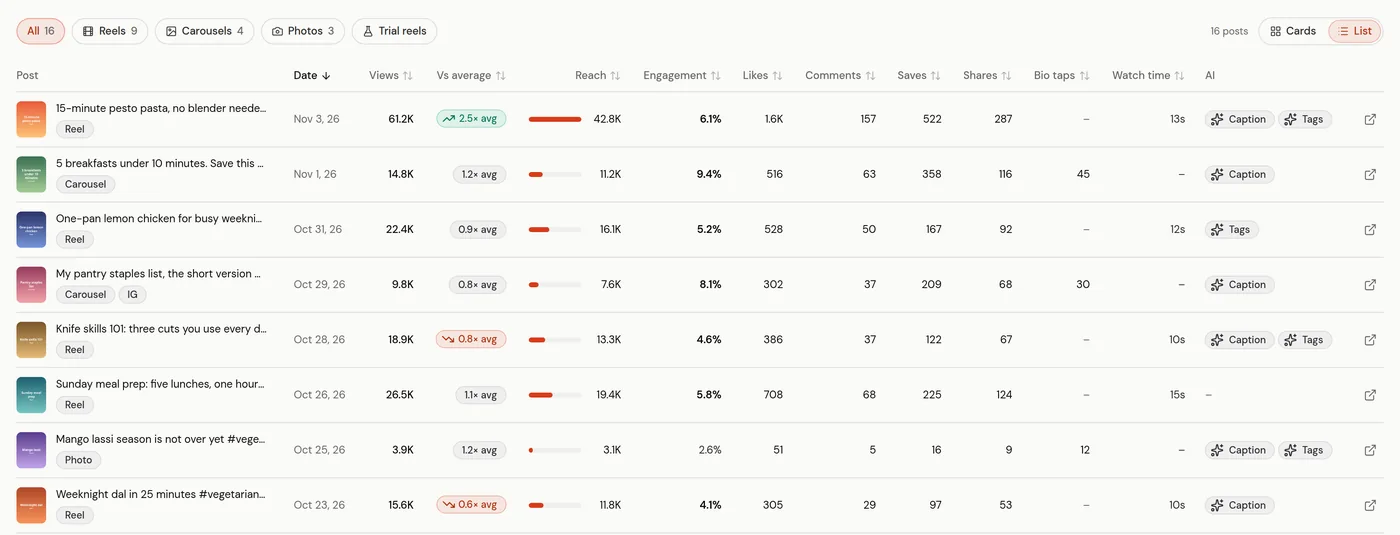
The Posts tab lists every post in the range, as cards or as a sortable list with views, reach, engagement, likes, comments, saves, shares, bio link taps and watch time. Filter it to reels, carousels, photos or trial reels.
Posts you publish straight from the Instagram app are included. ReelDrop checks your account for new posts about once an hour, and in the list those posts carry an IG badge. Watch time is Instagram's average watch time for the reel; Instagram reports it for reels only.
Vs average is the outlier check: a post's views divided by the average views of the same format in the range. 2.5× avg means two and a half times your usual views for that format. At 2× or more the badge points up; at 0.8× or less it points down.
Story analytics, saved before the story expires
Instagram only reports a story's numbers while it is live, so ReelDrop saves them every three hours during those 24 hours: views, reach, replies, shares, profile visits, follows, and taps forward, back and away. That covers stories you post from the Instagram app too, not only the ones scheduled here.
Overview ranks them under Top stories, and an expired story keeps its numbers. Recording starts when you connect your account, so a story that expired before that cannot be filled in afterwards. Instagram reports replies as 0 for viewers in Europe and Japan.
Schedule up to 10 stories at a time, on every plan.
Story schedulerTrial reel analytics
A trial reel is shown to non-followers first, and Instagram's API gives apps no trial-specific numbers. ReelDrop samples each trial reel for 7 days, every few minutes at first, then hourly, then every 6 hours, and draws a views and reach curve with views at 24 and 72 hours. A sudden jump in reach is flagged as the likely moment it was shared to followers. Choose Trial reels on the Posts tab to see them.
Test a hook on non-followers before your followers see it.
Trial reelsAudience: followers, demographics and who engaged
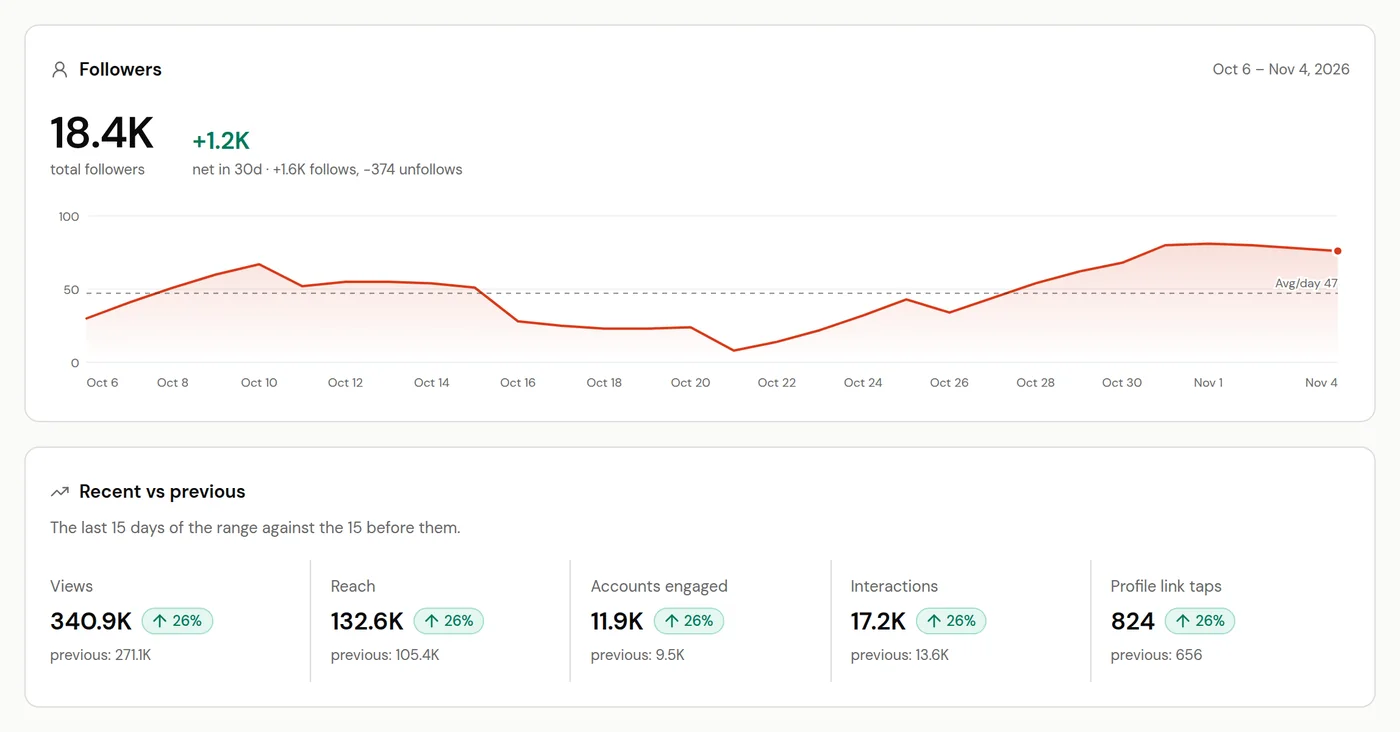
The Audience tab shows your follower count with follows and unfollows, new followers a day, and Recent vs previous for views, reach, accounts engaged, interactions and profile link taps, again the most recent half of the range against the half before it.
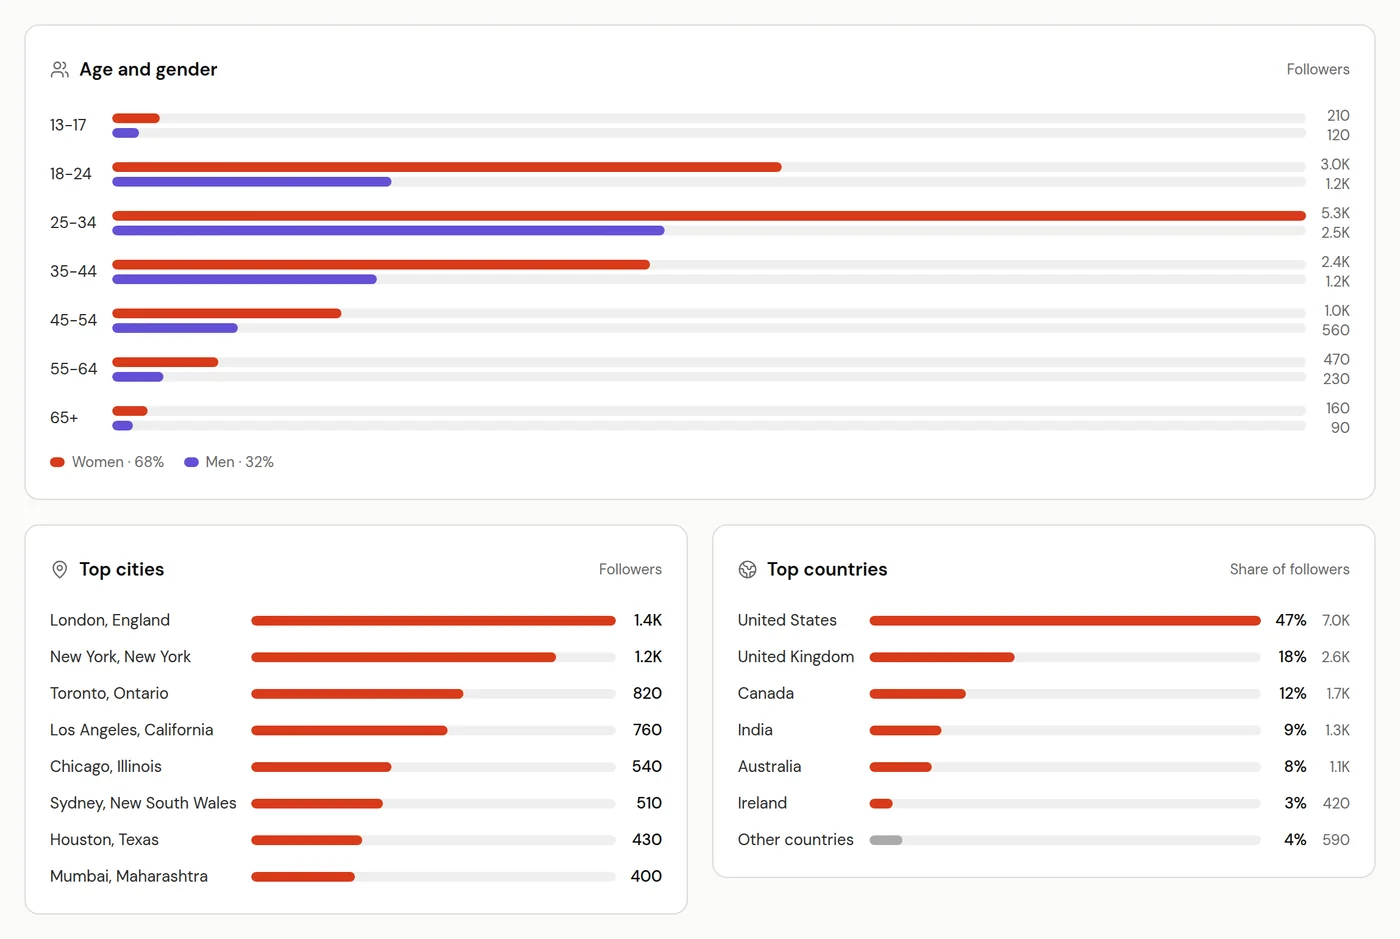
Demographics are Instagram's figures for your followers this month: age and gender, top cities and top countries. Engaged audience gives the same breakdown for the people who liked, commented, shared, saved or replied, followers or not, and marks the places that are not among your top follower locations, which is where your content is reaching new people.
Below 100 followers, Instagram withholds demographics and daily follower counts, and the tab says how many followers are left to go. Engaged-audience details need 100 engagements in the period and can lag by up to 48 hours.
Weekly recap, posting streak and badges
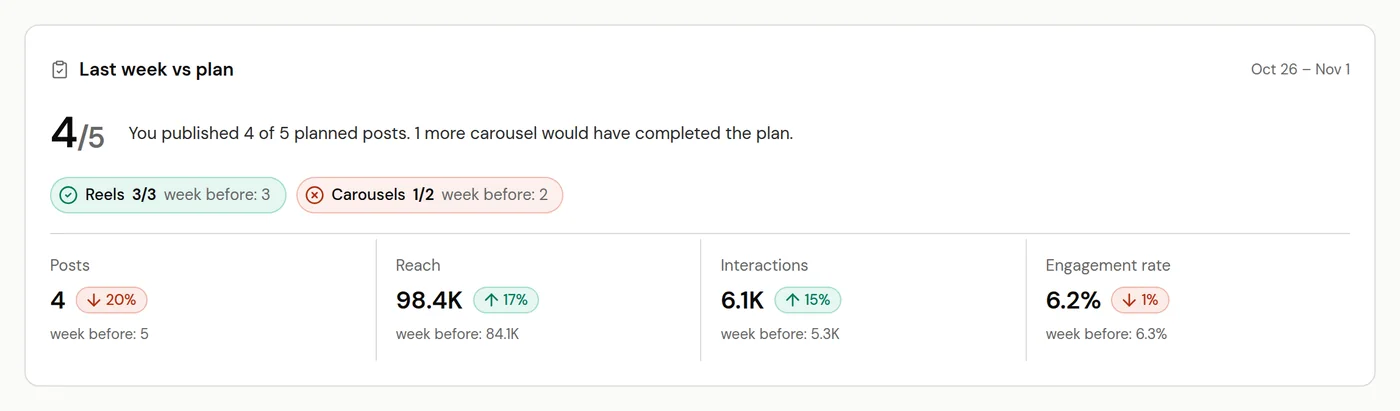
Last week vs plan, on the Plan tab, scores the last full Monday to Sunday: how many posts went out against how many the plan called for, a hit or a miss for each format, and posts, reach, interactions and engagement rate against the week before. One sentence names what would have closed the gap, such as "1 more carousel would have completed the plan."
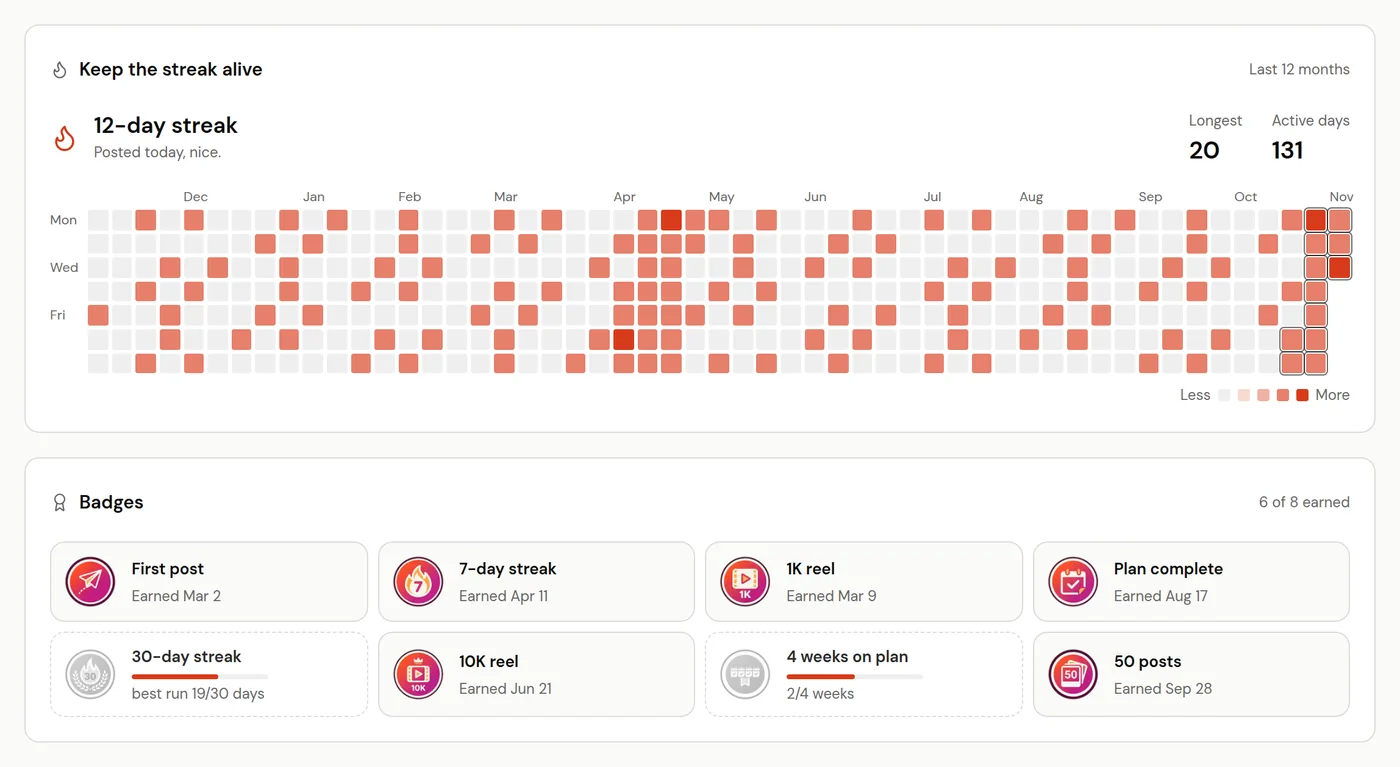
Keep the streak alive counts the days in a row you have posted, stories included, and shows the last 12 months as a calendar; a day with nothing posted yet only breaks the streak once it is over. Eight badges mark plain milestones: First post, 7-day streak, 30-day streak, 50 posts, 1K reel and 10K reel (one reel reaching 1,000 or 10,000 accounts), Plan complete and 4 weeks on plan. A badge, once earned, is never taken away.
Weekly and monthly email digests
Every Monday the weekly digest emails the account owner last week's numbers: the follower change, then views, reach, accounts engaged and interactions against the week before, and engagement rate. It adds the top three posts, what is working by format, your strongest posting window when there is enough data, and how the week went against the plan. The monthly digest covers the previous month on the 1st.
Both go out at 9 am in the timezone set in Settings (UTC if none is set), and only when there is something to report: a post published or failed, or some reach. To stop them, open Settings, then Notifications, and switch off weekly stats or monthly stats, or use the Unsubscribe link at the bottom of the email.
Milestone cards you can share
When your account passes a follower milestone (1K, 5K, 10K, 25K, 50K, 100K and on to 10M) or a 30-day views milestone (10K, 50K, 100K and up), ReelDrop sends a notification and an email with a card made to share. Each milestone gets its own page at reeldrop.io/m/ followed by a 12-character code, with a square card for posts, a 9:16 version for your Story, and share buttons for X, LinkedIn and Facebook.
The page is unlisted (search engines are told not to index it) and shows your handle and the milestone, nothing else from your account. Milestones you had already passed when you connected are recorded quietly, so the first email is for a new one. Switch the emails off under Settings, Notifications, milestones; the card is still made and the bell still tells you.
Media kit with suggested collab rates, on Creator
The Media kit tab turns your live stats into a one-page PDF for brands: followers, average views over your last 7 reels, engagement rate, posts per week, your audience split and top countries, the formats you post and recent posts. Pick one of five themes and add a short bio (or have one drafted for you), an audience line, a contact email and brands you have worked with. The preview is the PDF itself.
Suggested collab rates gives a low, typical and high price for a sponsored reel, a feed post, a carousel, a 3-frame story set and a UGC video, plus three packages. Rates start from your followers and average reel views and are adjusted for engagement, niche and market, priced for the US, Canada, the UK, Australia or India in that currency. They are benchmarks for negotiating, and they stay out of the PDF.
The kit's engagement rate is the one brands use, likes and comments over followers, so it will not match the reach-based rate elsewhere in Analytics. The media kit is on the Creator plan; on Starter and Influencer the tab explains what it builds and offers the upgrade.
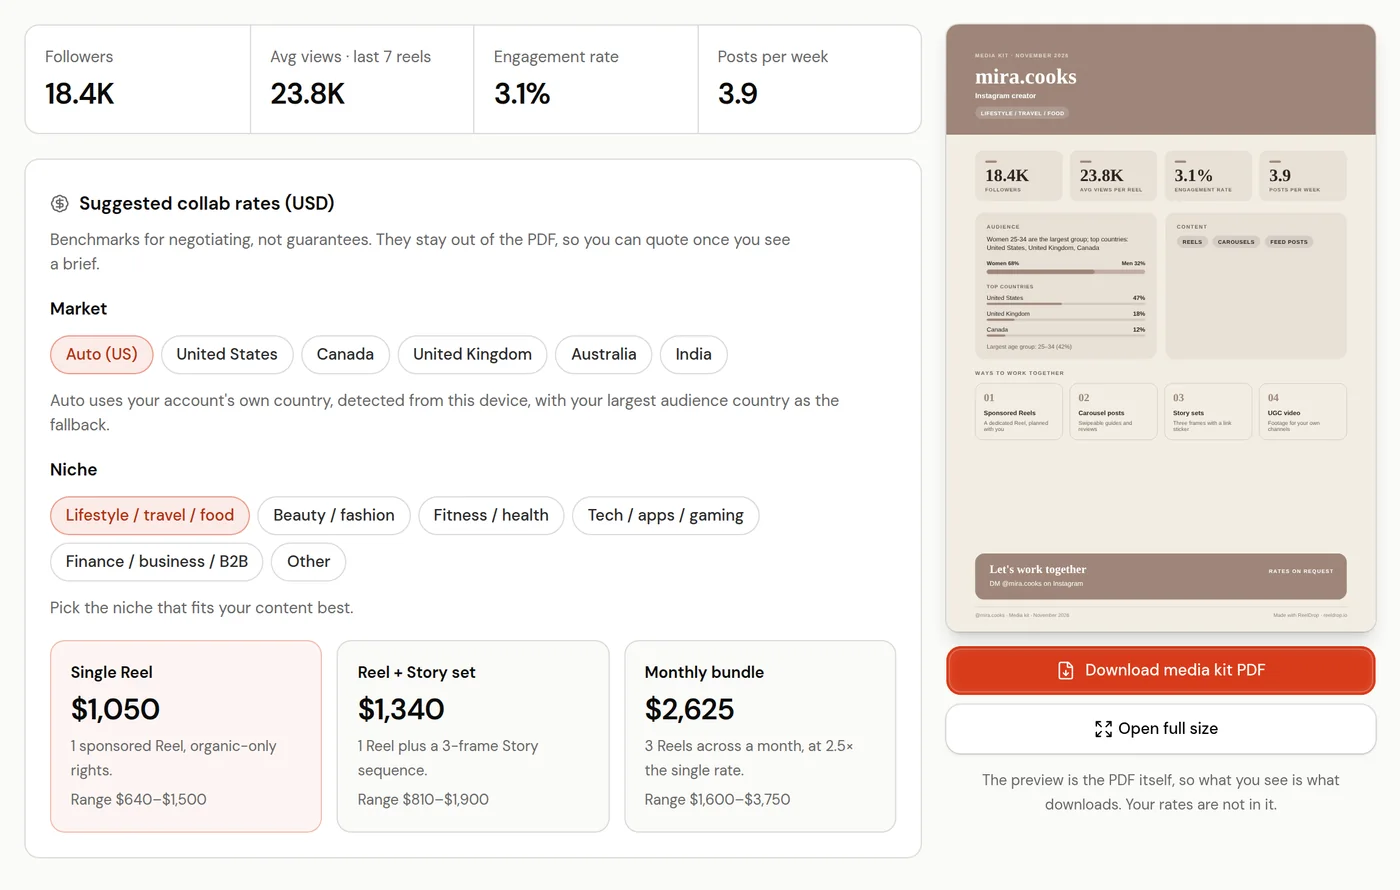
The rates use the same model as the free collab rate calculator, which takes the numbers by hand.
Not on Creator? Build a kit by hand with the free media kit generator.
Media kit generatorAsk Claude or ChatGPT about your numbers
ReelDrop's MCP server has 7 analytics tools among its 58: get_analytics_summary, get_reel_analytics, get_account_analytics, get_story_analytics, get_content_plan, get_weekly_recap and get_trial_reel_analytics. They are read-only, they read the same data as the Analytics page, and MCP access is on every plan, so "which of last month's reels held viewers longest?" is a question you can ask in chat.
Connect Claude, ChatGPT or Cursor once and ask from chat.
ReelDrop MCPDeciding what to make next week
A food creator opens the Plan tab on Sunday evening. Carousels say Double down at 1.46× her average engagement, photo posts say Ease off, and Last week vs plan shows she was one carousel short. She swaps next week's photo post for a carousel and schedules it in the window her When to post grid ranks first.
Answering a brand's email with a price
A creator with 18,400 followers gets a sponsorship enquiry. On Creator, the Media kit tab suggests $640 to $1,500 for a sponsored reel in the US. They download the PDF, which carries the stats but not the rates, and quote once they have read the brief.
Reading a story campaign after it expired
A café posts three stories from the Instagram app at 7:30 one morning. The next day they are gone from Instagram, but Analytics still has their reach, replies and exits, and Top stories shows which one people tapped away from.
Analytics by plan
Analytics has no plan limit of its own: no history cap and no locked tab except the media kit. The only window is Instagram's, which keeps account-level insights for 90 days.
| Capability | Starter (free) | Influencer ($9.99/mo) | Creator ($29/mo) |
|---|---|---|---|
| Overview, Plan, Posts and Audience tabs | Yes | Yes | Yes |
| Posts published outside ReelDrop included | Yes | Yes | Yes |
| Story analytics, saved while stories are live | Yes | Yes | Yes |
| Weekly recap, posting streak and badges | Yes | Yes | Yes |
| Weekly and monthly email digests | Yes | Yes | Yes |
| Milestone cards | Yes | Yes | Yes |
| Trial reels tracked for 7 days | Yes, up to 3 trial reels a month | Yes, unlimited | Yes, unlimited |
| Media kit PDF and suggested collab rates | No | No | Yes |
| Analytics from Claude or ChatGPT (MCP) | Yes | Yes | Yes |
Read the docs
Frequently asked questions
Is ReelDrop's Instagram analytics free?
Yes. The Overview, Plan, Posts and Audience tabs, story and trial reel analytics, the weekly recap, email digests and milestone cards are on every plan, including the free Starter plan. The media kit with suggested collab rates is on Creator.
Where does ReelDrop get the numbers?
From the Instagram Graph API for the Business or Creator account you connect, with the permission you grant when connecting. ReelDrop never asks for your Instagram password.
Does it include posts I did not publish with ReelDrop?
Yes. ReelDrop checks your account for new posts about once an hour and adds them to Analytics, marked with an IG badge in the Posts list. Stories posted from the Instagram app are saved too.
How is engagement rate calculated?
For posts: likes, comments, saves and shares divided by reach. For stories: Instagram's total interactions divided by reach. The media kit uses the brand-side formula, likes and comments divided by followers, so the two figures differ.
Can I see analytics for a story after it expires?
Yes, if ReelDrop recorded it while it was live. Stories are saved every three hours from the day you connect your account; one that expired before you connected cannot be recovered, because Instagram no longer reports it.
Why can't I see my audience demographics?
Instagram only shares follower demographics from 100 followers. Above that, they can take a few days to appear on a newly connected account.
How do I stop the weekly analytics email?
Open Settings, then Notifications, and switch off weekly stats (or monthly stats). Every digest also has an Unsubscribe link at the bottom.
Do I need a business account?
Yes, a Business or Creator account. Instagram's insights API only works with professional accounts, and switching a personal account is free in the Instagram app.
Keep exploring
Stop managing Instagram. Start growing with it.
Sign up free for AI carousels, DM automation, captions, and scheduling: built for creators who post less and grow more.
Built in Toronto by Piyush Sachdeva.